

XRP Price Prediction: AI Models See $4-$8 Target as Legal Overhang Lifts
ChatGPT analysis predicts multi-year run to $6-$8 by late 2026, but current price at $1.02 reveals the real challenge begins now that the lawsuit has ended.

By Jane Doe
Published on Aug 11, 2026
 Cryptorah
Quick Take
- AI-driven price prediction models XRP at $4-$6 by end of 2026, with potential $7-$8 breakout in full risk-on scenarios
- SEC lawsuit closure removes major legal overhang, while spot ETFs and CME futures introduce institutional demand infrastructure
- Current price sits at $1.02, beneath the bearish scenario range, with RSI at 38.25 signaling continued seller control
- Bear case centers on crypto market weakness, disappointing ETF flows, and large Ripple-controlled supply keeping price range-bound
What Happened
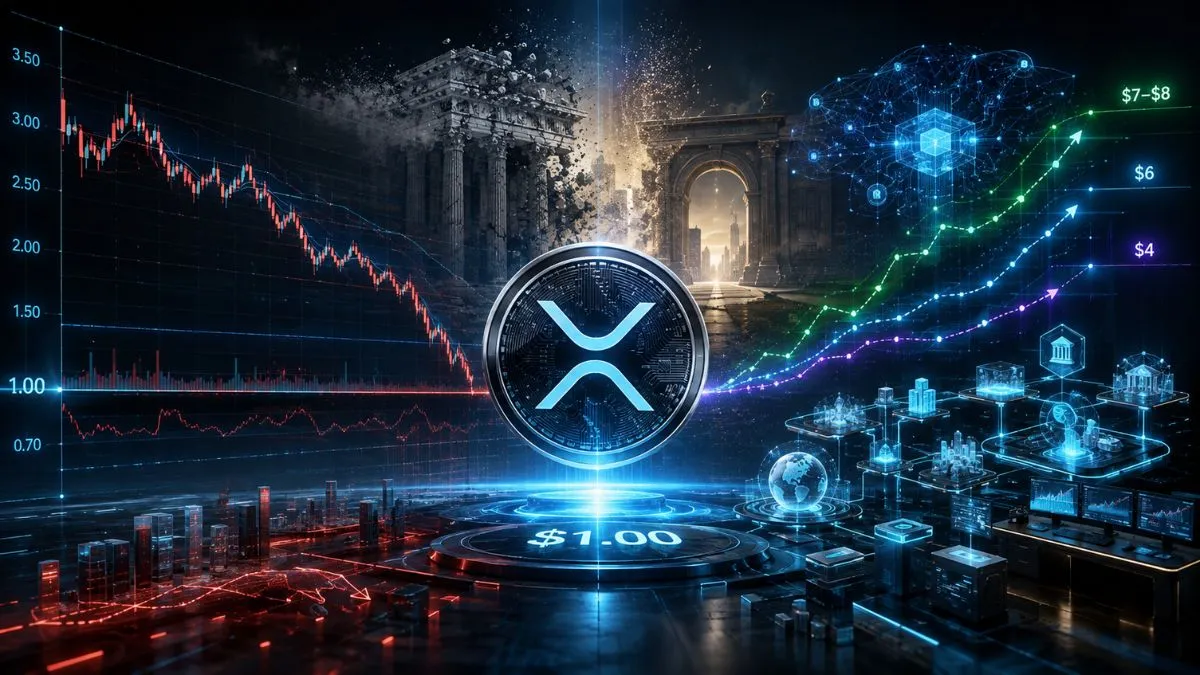
AI analysis conducted through ChatGPT has produced a structured price forecast for XRP that factors in the conclusion of the multi-year SEC litigation. The model projects a base-case target range of $4 to $6 by the end of 2026, starting from the current level of $1.02. In a full risk-on market environment, the upper boundary extends to $7-$8.
The prediction framework treats the removal of SEC regulatory uncertainty as a fundamental shift in XRP's investment thesis. According to the analysis, this development makes the current cycle stronger than any prior period in XRP's history because it eliminates what had been the asset's largest structural headwind.
The bullish scenario rests on several institutional infrastructure developments that have emerged or expanded following the lawsuit's resolution. U.S. spot XRP exchange-traded funds have created direct channels for institutional capital allocation. CME Group has launched XRP futures and options contracts, adding regulated derivative products for hedging and liquidity provision.
On the technology side, the XRP Ledger is seeing broader adoption across multiple use cases. RLUSD settlement functionality, tokenized asset infrastructure, and institutional decentralized finance applications are all directing on-chain activity to the network. Native lending protocols and Ethereum Virtual Machine compatibility have expanded the developer toolkit available on the ledger. Ripple's corporate acquisition strategy has targeted prime brokerage, treasury services, and payments infrastructure, deepening its footprint in institutional finance.
Why It Matters
Market Structure Shift: The transition from a legally-contested asset to one with regulatory clarity fundamentally alters XRP's addressable market. Institutional investors and fund managers operating under compliance mandates can now evaluate XRP without the binary risk of an adverse SEC ruling.
The introduction of regulated derivative products through CME represents a maturation of XRP's market infrastructure. Futures and options contracts enable institutional participants to hedge exposure, express directional views with leverage, and manage portfolio risk—capabilities that were absent or limited during the lawsuit period.
Spot ETF products compress the friction between traditional financial institutions and crypto exposure. Rather than navigating custody solutions, wallet security, and operational overhead, institutions can access XRP through familiar brokerage channels with standard settlement infrastructure.
The ledger's expanding technical capabilities create a feedback loop between utility and demand. As more institutions build settlement, tokenization, and DeFi applications on the XRP Ledger, network effects compound. Each new use case adds transaction volume, which in turn attracts additional developers and enterprise adopters.
The AI model's reference to potential further U.S. regulatory clarity before year-end 2026 suggests that even with the lawsuit resolved, the market may still be pricing in residual regulatory uncertainty. A definitive framework from U.S. regulators could serve as an additional catalyst layer.
The Numbers
Price Movement Context
XRP reached a peak above $3.60 in July of the prior year. From that high, the asset has experienced consistent downward pressure through multiple support levels. October saw a decline toward $2.60. By February, price had broken below $1.80 and continued down near $1.15.
A trading range between $1.30 and $1.55 formed during the spring months, appearing to establish a floor. That structure failed in June, with price dropping under $1.20. The July and August period has been characterized by gradual erosion, bringing XRP to its current level of $1.02823, down 0.09% and $0.00094 in the most recent session.
The intraday range for the latest session spanned from $1.02713 to $1.04020. Immediate support is identified at the psychological $1.00 level. Resistance layers sit at $1.10, then $1.20, and $1.40 above current price.
Technical Indicator Snapshot
The Relative Strength Index currently reads 38.25, with its signal line positioned above at 41.62. The oscillator trails by more than three points, confirming that selling pressure remains dominant. While the RSI sits close to oversold territory, it has not yet triggered that threshold. Momentum indicators point downward with no reversal pattern evident in the current data.
Market Reaction
The disconnect between the AI model's optimistic long-term forecast and current price action is significant. XRP's position at $1.02 places it beneath even the bearish scenario range outlined in the analysis, which starts at $1.20 and extends down to $0.70.
Chart data shows that none of the positive developments—lawsuit resolution, ETF launches, CME product listings, ledger expansion—have translated into sustained upward price movement. The asset has instead recorded consistent lower highs from the $3.60 peak through the current sub-$1.10 level.
The RSI configuration, with the main indicator trailing its signal line in the upper-30s range, indicates that selling pressure has not yet exhausted. Market participants are either unconvinced by the bullish narrative, pricing in factors not captured in the AI model, or waiting for confirmation through price structure before re-entering positions.
Bear Case Framework
The analysis identifies three primary downside risks. First, continued weakness in the broader cryptocurrency market would create headwinds regardless of XRP-specific developments. Macro risk-off conditions, regulatory pressure in other jurisdictions, or liquidity constraints across digital assets would likely pull XRP lower in correlation.
Second, the actual demand flowing into spot XRP ETF products may disappoint relative to expectations. The ETF approval removes access barriers, but does not guarantee institutional allocation. If fund flows remain modest, one of the key bullish pillars weakens considerably.
Third, and most structural, is the large quantity of XRP supply still controlled by Ripple. The company's holdings create persistent overhang concerns. Even with strong fundamental developments, concentrated supply in the hands of a single entity can cap price appreciation if the market perceives future selling pressure. In the bear scenario, these three factors combine to constrain XRP within a $0.70 to $1.20 range.
What's Next / Things to Watch
The immediate technical test is whether XRP can hold above the $1.00 psychological support level. A breakdown below that threshold would likely accelerate selling and bring the lower bear-case boundary of $0.70 into focus.
On the upside, reclaiming $1.10 and then $1.20 would begin to validate the bullish structure. Those levels represent near-term resistance clusters that have capped prior rallies. A sustained move above $1.20 would place XRP back within the bear-case range and start to rebuild upside momentum.
The AI analysis flags potential U.S. regulatory clarity as a catalyst still on the table before the end of 2026. Specific guidance from the SEC or Congressional legislation addressing digital asset classification would reduce uncertainty and could trigger institutional re-evaluation of XRP exposure.
ETF flow data will be a critical forward indicator. Published fund inflow and outflow reports will reveal whether institutional demand is materializing at the scale required to support the base-case price targets. Disappointing flows would lend weight to the bear scenario; strong accumulation would validate the bullish thesis.
Ripple's ongoing acquisitions and partnership announcements will provide insight into the pace of institutional adoption. Each new enterprise deployment on the XRP Ledger adds tangible utility and real-world transaction volume, which feeds directly into the fundamental valuation framework.
The RSI indicator's potential move into or out of oversold territory will signal whether the current downtrend is nearing exhaustion. A bullish divergence—where RSI forms higher lows while price makes lower lows—would be an early technical signal that selling pressure is weakening.
Frequently Asked Questions
What is the basis for the $4-$8 XRP price prediction by end of 2026?
The ChatGPT AI model's forecast integrates the removal of SEC lawsuit overhang, new institutional infrastructure through spot ETFs and CME derivatives, expanding XRP Ledger adoption for settlement and DeFi, and the potential for additional U.S. regulatory clarity. The base case ($4-$6) assumes moderate realization of these catalysts; the upper range ($7-$8) requires a full risk-on market environment.
Why is XRP currently trading below even the bearish scenario range?
At $1.02, XRP sits beneath the $1.20 lower bound of the AI model's bear case. This suggests the market is either pricing in risks not captured in the model (such as continued crypto market weakness or ETF demand disappointment), waiting for technical confirmation of a trend reversal, or discounting the timeline over which bullish catalysts will materialize.
How does the Ripple-controlled supply impact XRP's price potential?
The large quantity of XRP still held by Ripple creates structural overhang. Even with strong fundamentals, concentrated supply in one entity's hands can cap price appreciation because the market anticipates potential future selling. This factor is identified as the most structural element of the bear case and could keep XRP range-bound between $0.70 and $1.20 if other negative conditions align.
What technical levels should XRP holders watch in the near term?
The $1.00 psychological support is the immediate test; breaking below it would likely accelerate downside toward the $0.70 bear-case floor. On the upside, reclaiming $1.10, then $1.20, would signal rebuilding bullish momentum. The RSI at 38.25 is approaching oversold but has not yet triggered, so momentum still favors sellers until a technical reversal pattern emerges.
When might additional U.S. regulatory clarity arrive for XRP?
The AI analysis references the possibility of further U.S. regulatory clarity arriving before the end of 2026, treating it as a major catalyst still on the table. However, no specific timeline or triggering event is provided in the source material. Market participants should monitor SEC guidance updates and potential Congressional legislation addressing digital asset classification.
AI-driven price prediction models typically integrate multiple data streams: historical price patterns, on-chain metrics (transaction volume, active addresses, supply distribution), macro market correlations, sentiment analysis from social and news sources, and fundamental developments (regulatory events, infrastructure launches, adoption metrics). These models use machine learning techniques to identify patterns and assign probabilistic weights to various scenarios. The output is generally a range rather than a point estimate, reflecting uncertainty in how future events will unfold and interact. The quality of such predictions depends heavily on the training data, the model's ability to adapt to regime changes (such as the removal of the SEC lawsuit overhang), and whether the model can account for non-linear or black-swan events. It is important to note that AI models are tools for scenario analysis, not certainties. They cannot predict unforeseen regulatory shifts, macroeconomic shocks, or technological failures that fall outside their training distribution.Technical Background: How AI Price Models Work
All price figures, technical indicators, and scenario ranges presented in this article are derived from the source content provided. The current price of $1.02823, RSI reading of 38.25, signal line at 41.62, intraday range ($1.02713 to $1.04020), and historical price levels ($3.60 peak, $2.60 October low, $1.15 February low, $1.30-$1.55 spring range) are taken directly from the supplied data. The AI-generated price targets ($4-$6 base case, $7-$8 risk-on breakout, $0.70-$1.20 bear case) and the catalysts identified (SEC lawsuit conclusion, spot ETFs, CME products, ledger adoption, regulatory clarity potential) are all sourced from the ChatGPT analysis referenced in the original content. No external data sources, third-party price feeds, or independent on-chain analytics were consulted for this report. All statements are grounded exclusively in the raw content supplied.Methodology & Sourcing Notes
Investment disclaimer: The content reflects the author’s personal views and current market conditions. Please conduct your own research before investing in cryptocurrencies, as neither the author nor the publication is responsible for any financial losses.
Ad Disclosure: This site may feature sponsored content and affiliate links. All advertisements are clearly labeled, and ad partners have no influence over our editorial content.

Related Articles

Fireplace Is Extinguished: Prediction Market Terminal Shuts Down 195 Days After Launch
Prediction markets terminal Fireplace is shutting down 195 days after launch, giving users until Sept 30 to withdraw funds — even after raising $1.5M and building for Polymarket and Kalshi.

CLARITY Act Push, Another Strategy Bitcoin Sale, and a Warning About Invisible Quantum Attacks
A recap of today's crypto news: the White House's push to pass the CLARITY Act by September, Strategy's latest Bitcoin sale to fund a stock buyback, and a warning about undetectable quantum-computing attacks on crypto wallets.

Standard Chartered: LINK Could Climb 25x to $200 if Tokenized Assets Hit $4T by 2028
Standard Chartered forecasts LINK could rise 25-fold to $200 by 2030 as tokenized real-world assets scale to $4 trillion, citing Chainlink's dominant oracle market position.

Bitcoin Presses New August Highs as CPI and PPI Loom Over the Fed's Next Move
Bitcoin hits new August highs as traders await July CPI and PPI data that could reshape Fed rate-hike odds, while the yen wobbles near 160 and large holders accumulate BTC at a multi-month pace.